Gallery
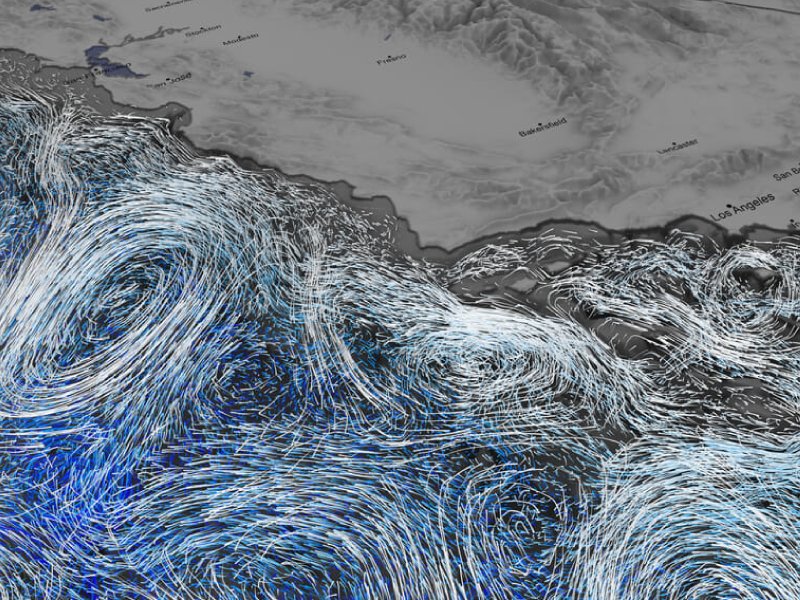
Ocean flows off the west coast of the United States. Credit: NASA’s Scientific Visualization Studio.
Ocean flows off the west coast of the United States. Credit: NASA’s Scientific Visualization Studio.
Ocean Flows off the US West Coast
[05-Nov-2020] This movie is part of a collection from NASA's Scientific Visualization Studio comprising visualizations of ocean flows created in support of NASA's 2020 sea level rise campaign. There are 5 regions of focus: The span of time shown in each visualization is about 10 months. The data used for each visualization comes from the ECCO-2 ocean model using data from 2010-01-15T00:12:58 to 2010-11-22T11:10:31. Each frame of the animation is approximately 2 hours apart. Original Media »
 Click on the image to play the movie. Click on the Escape key or anywhere outside the shadowbox to close.


