
Ocean Heat Content
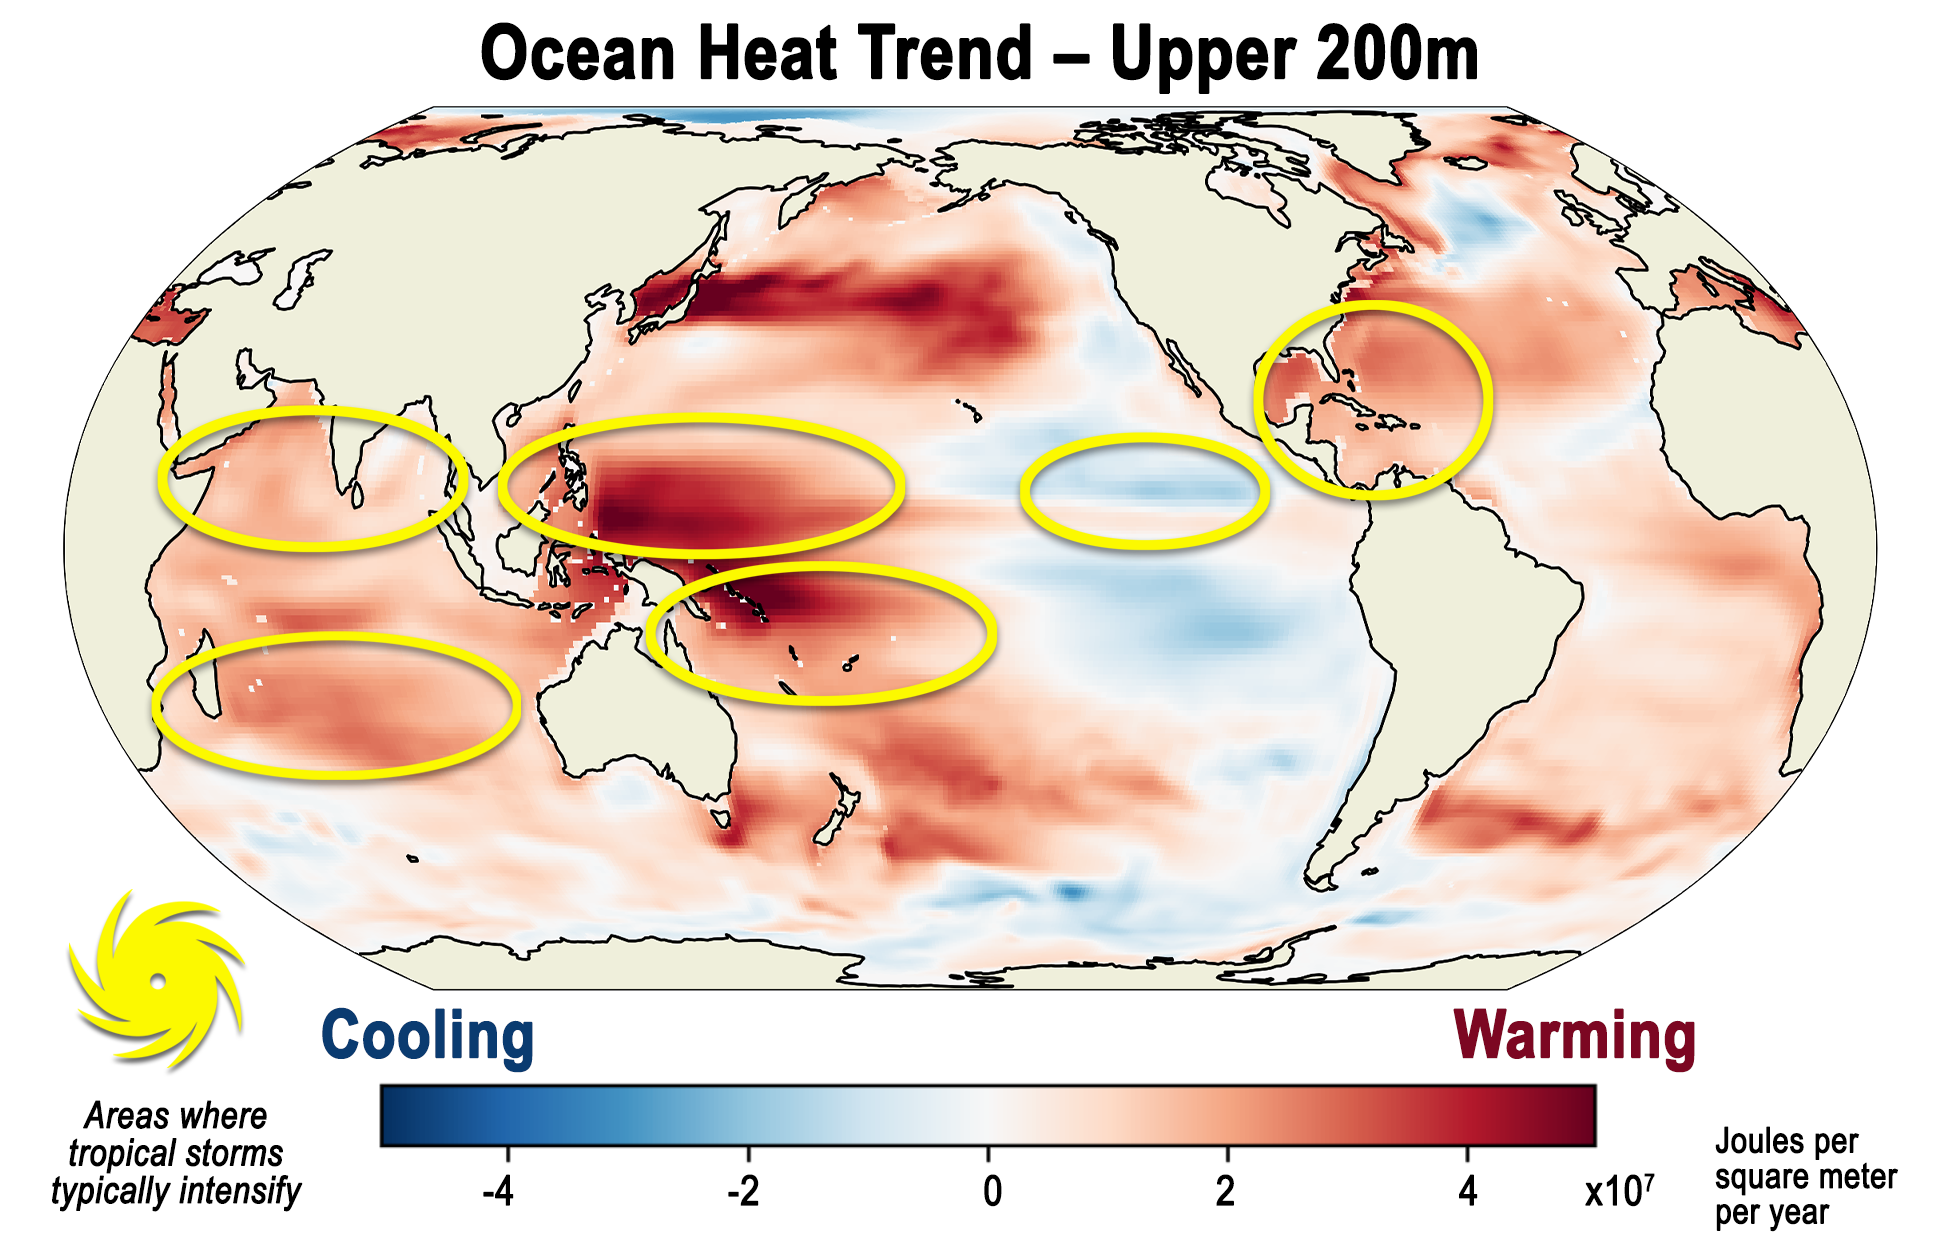
Our climate has been warming for decades but where does the excess heat generated by human activity go? The ocean absorbs more than 90% of the excess heat from global warming.
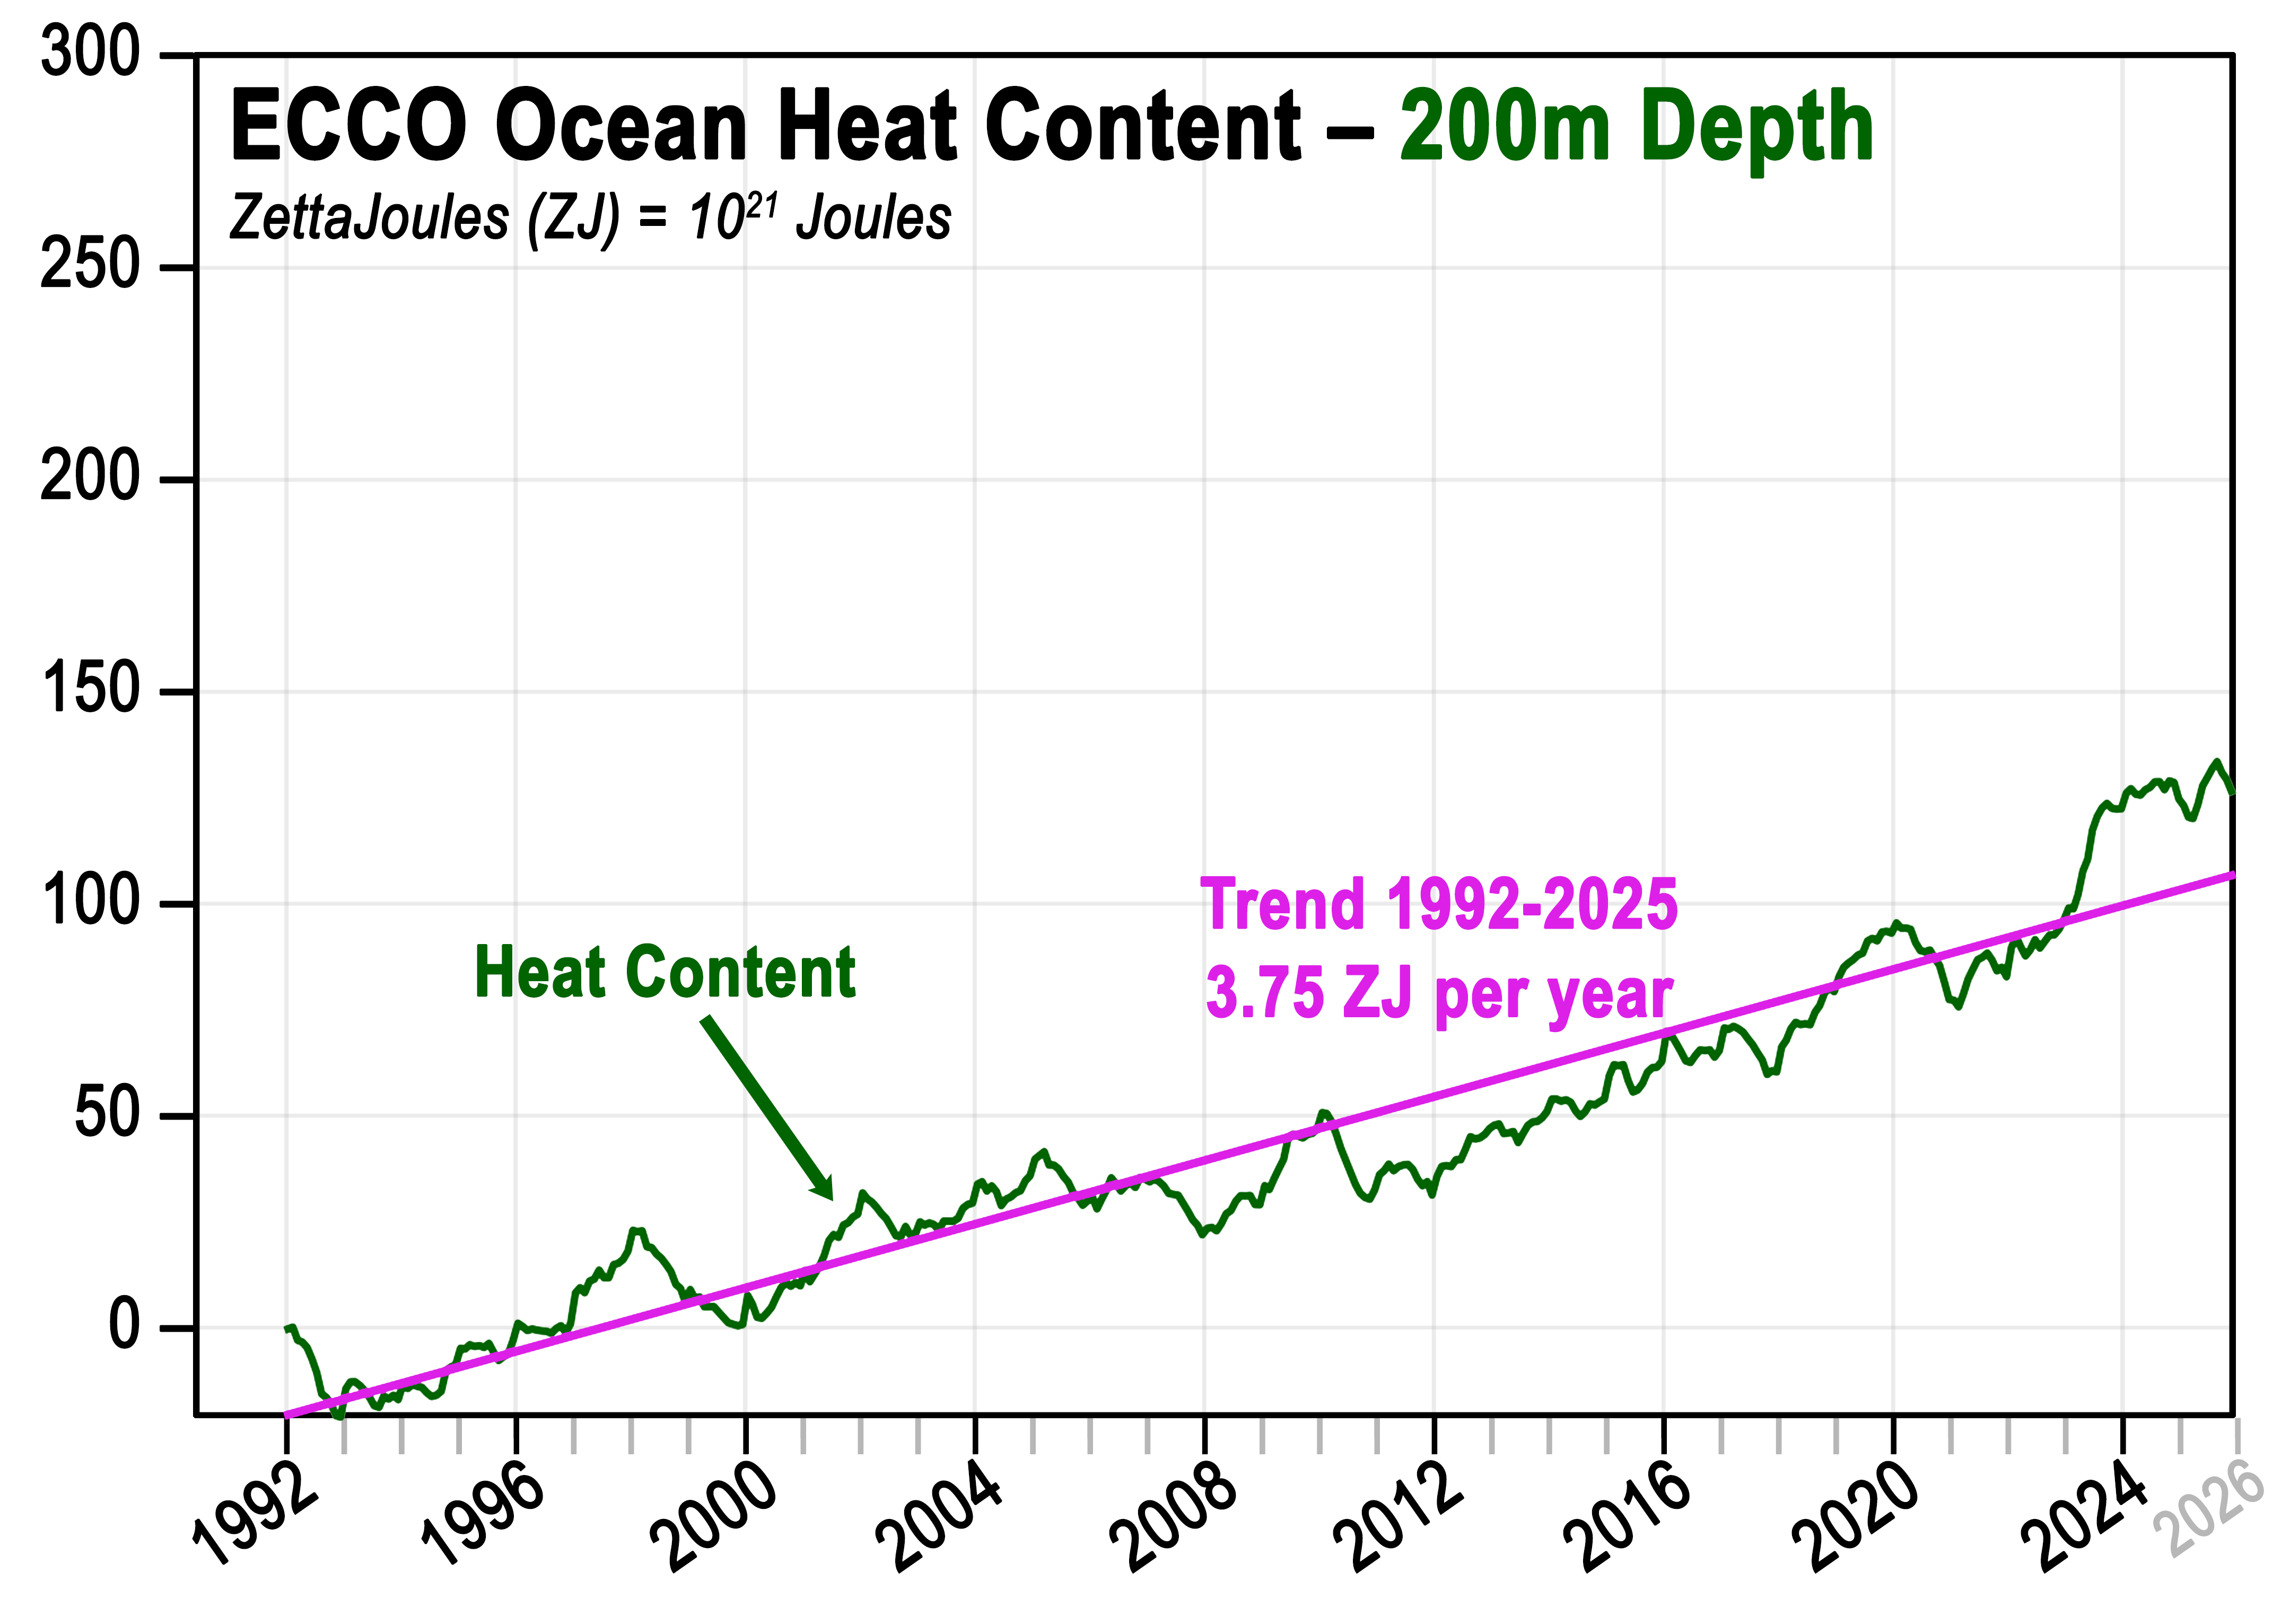
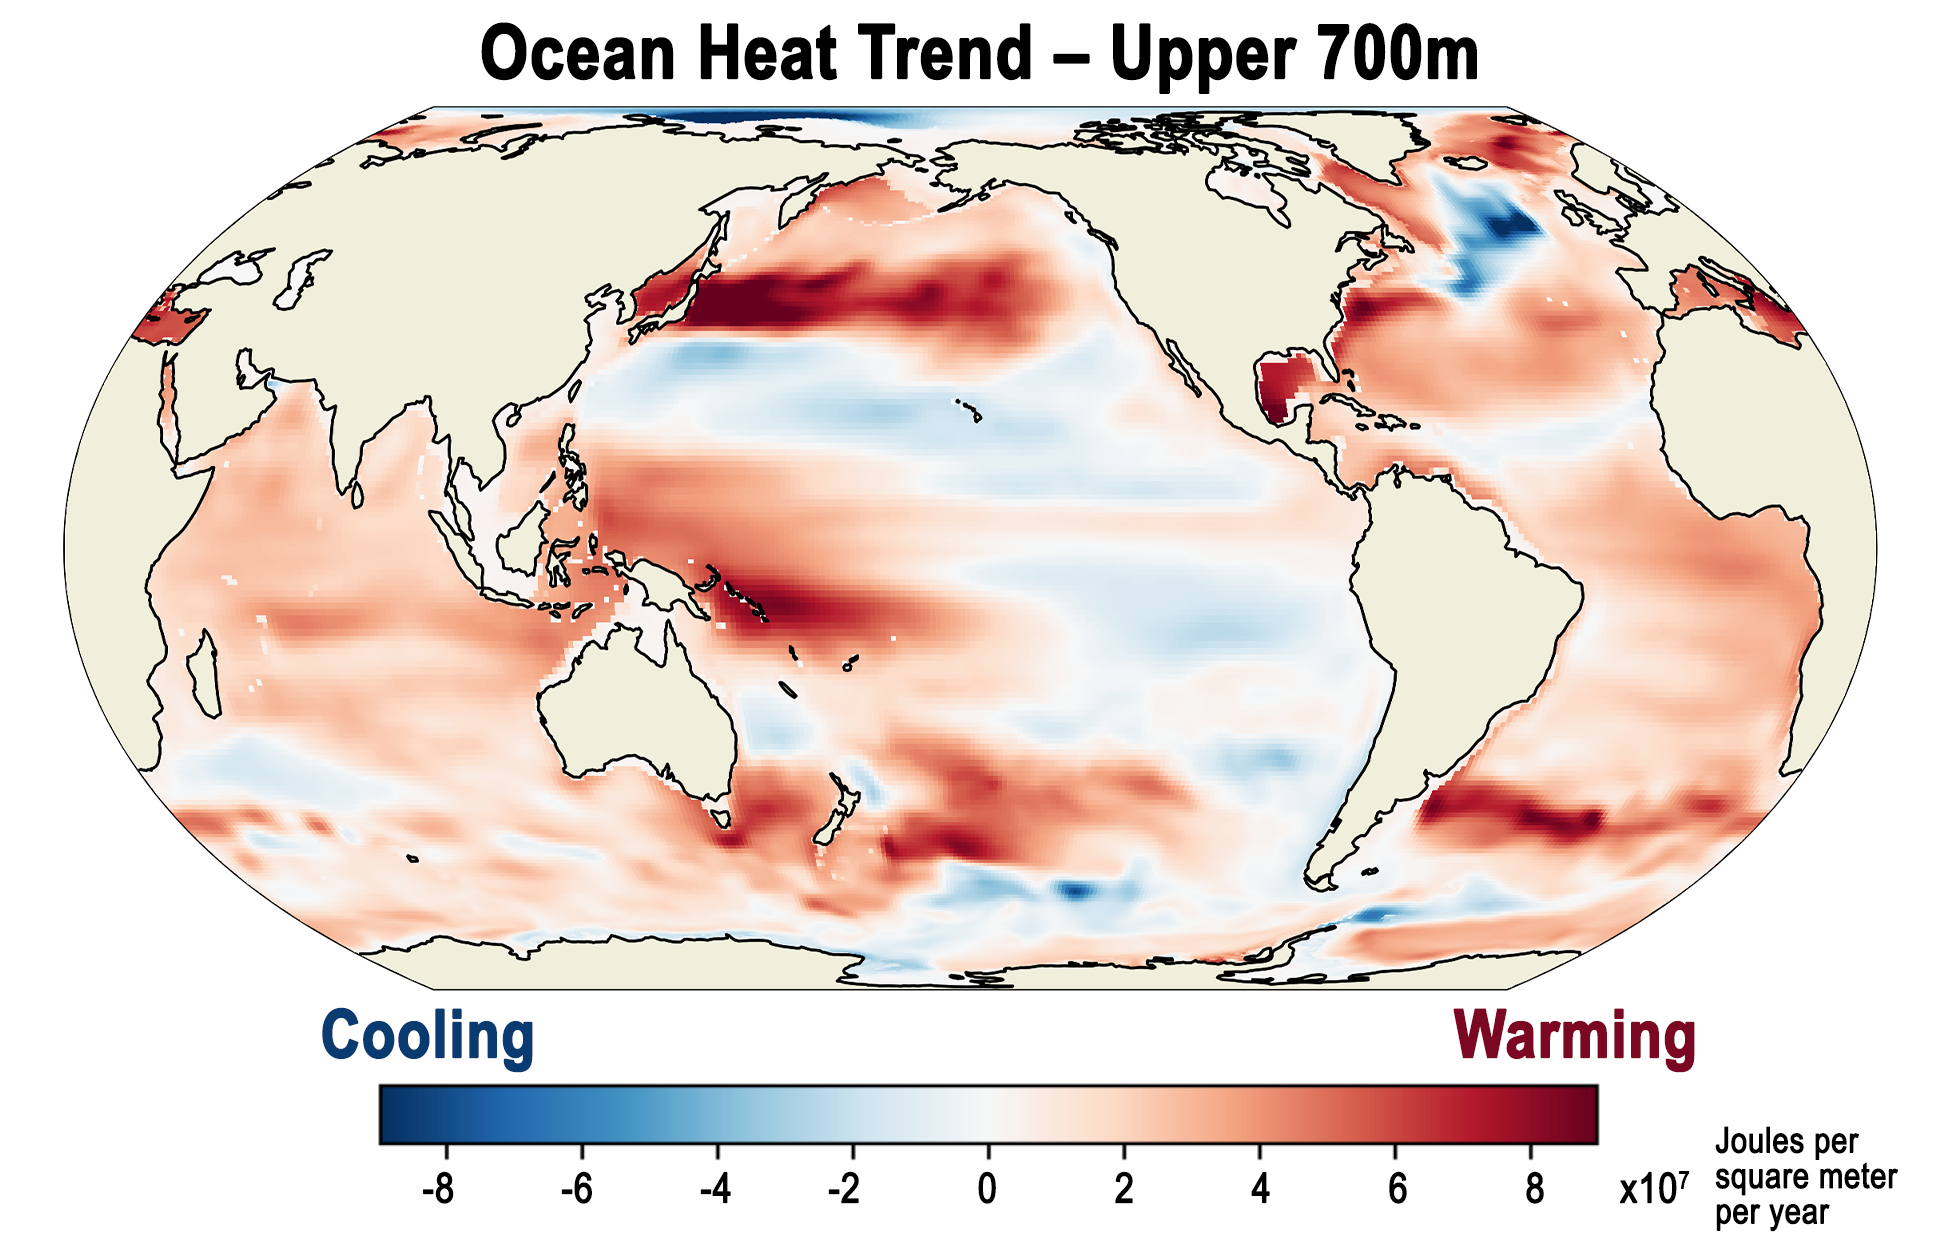
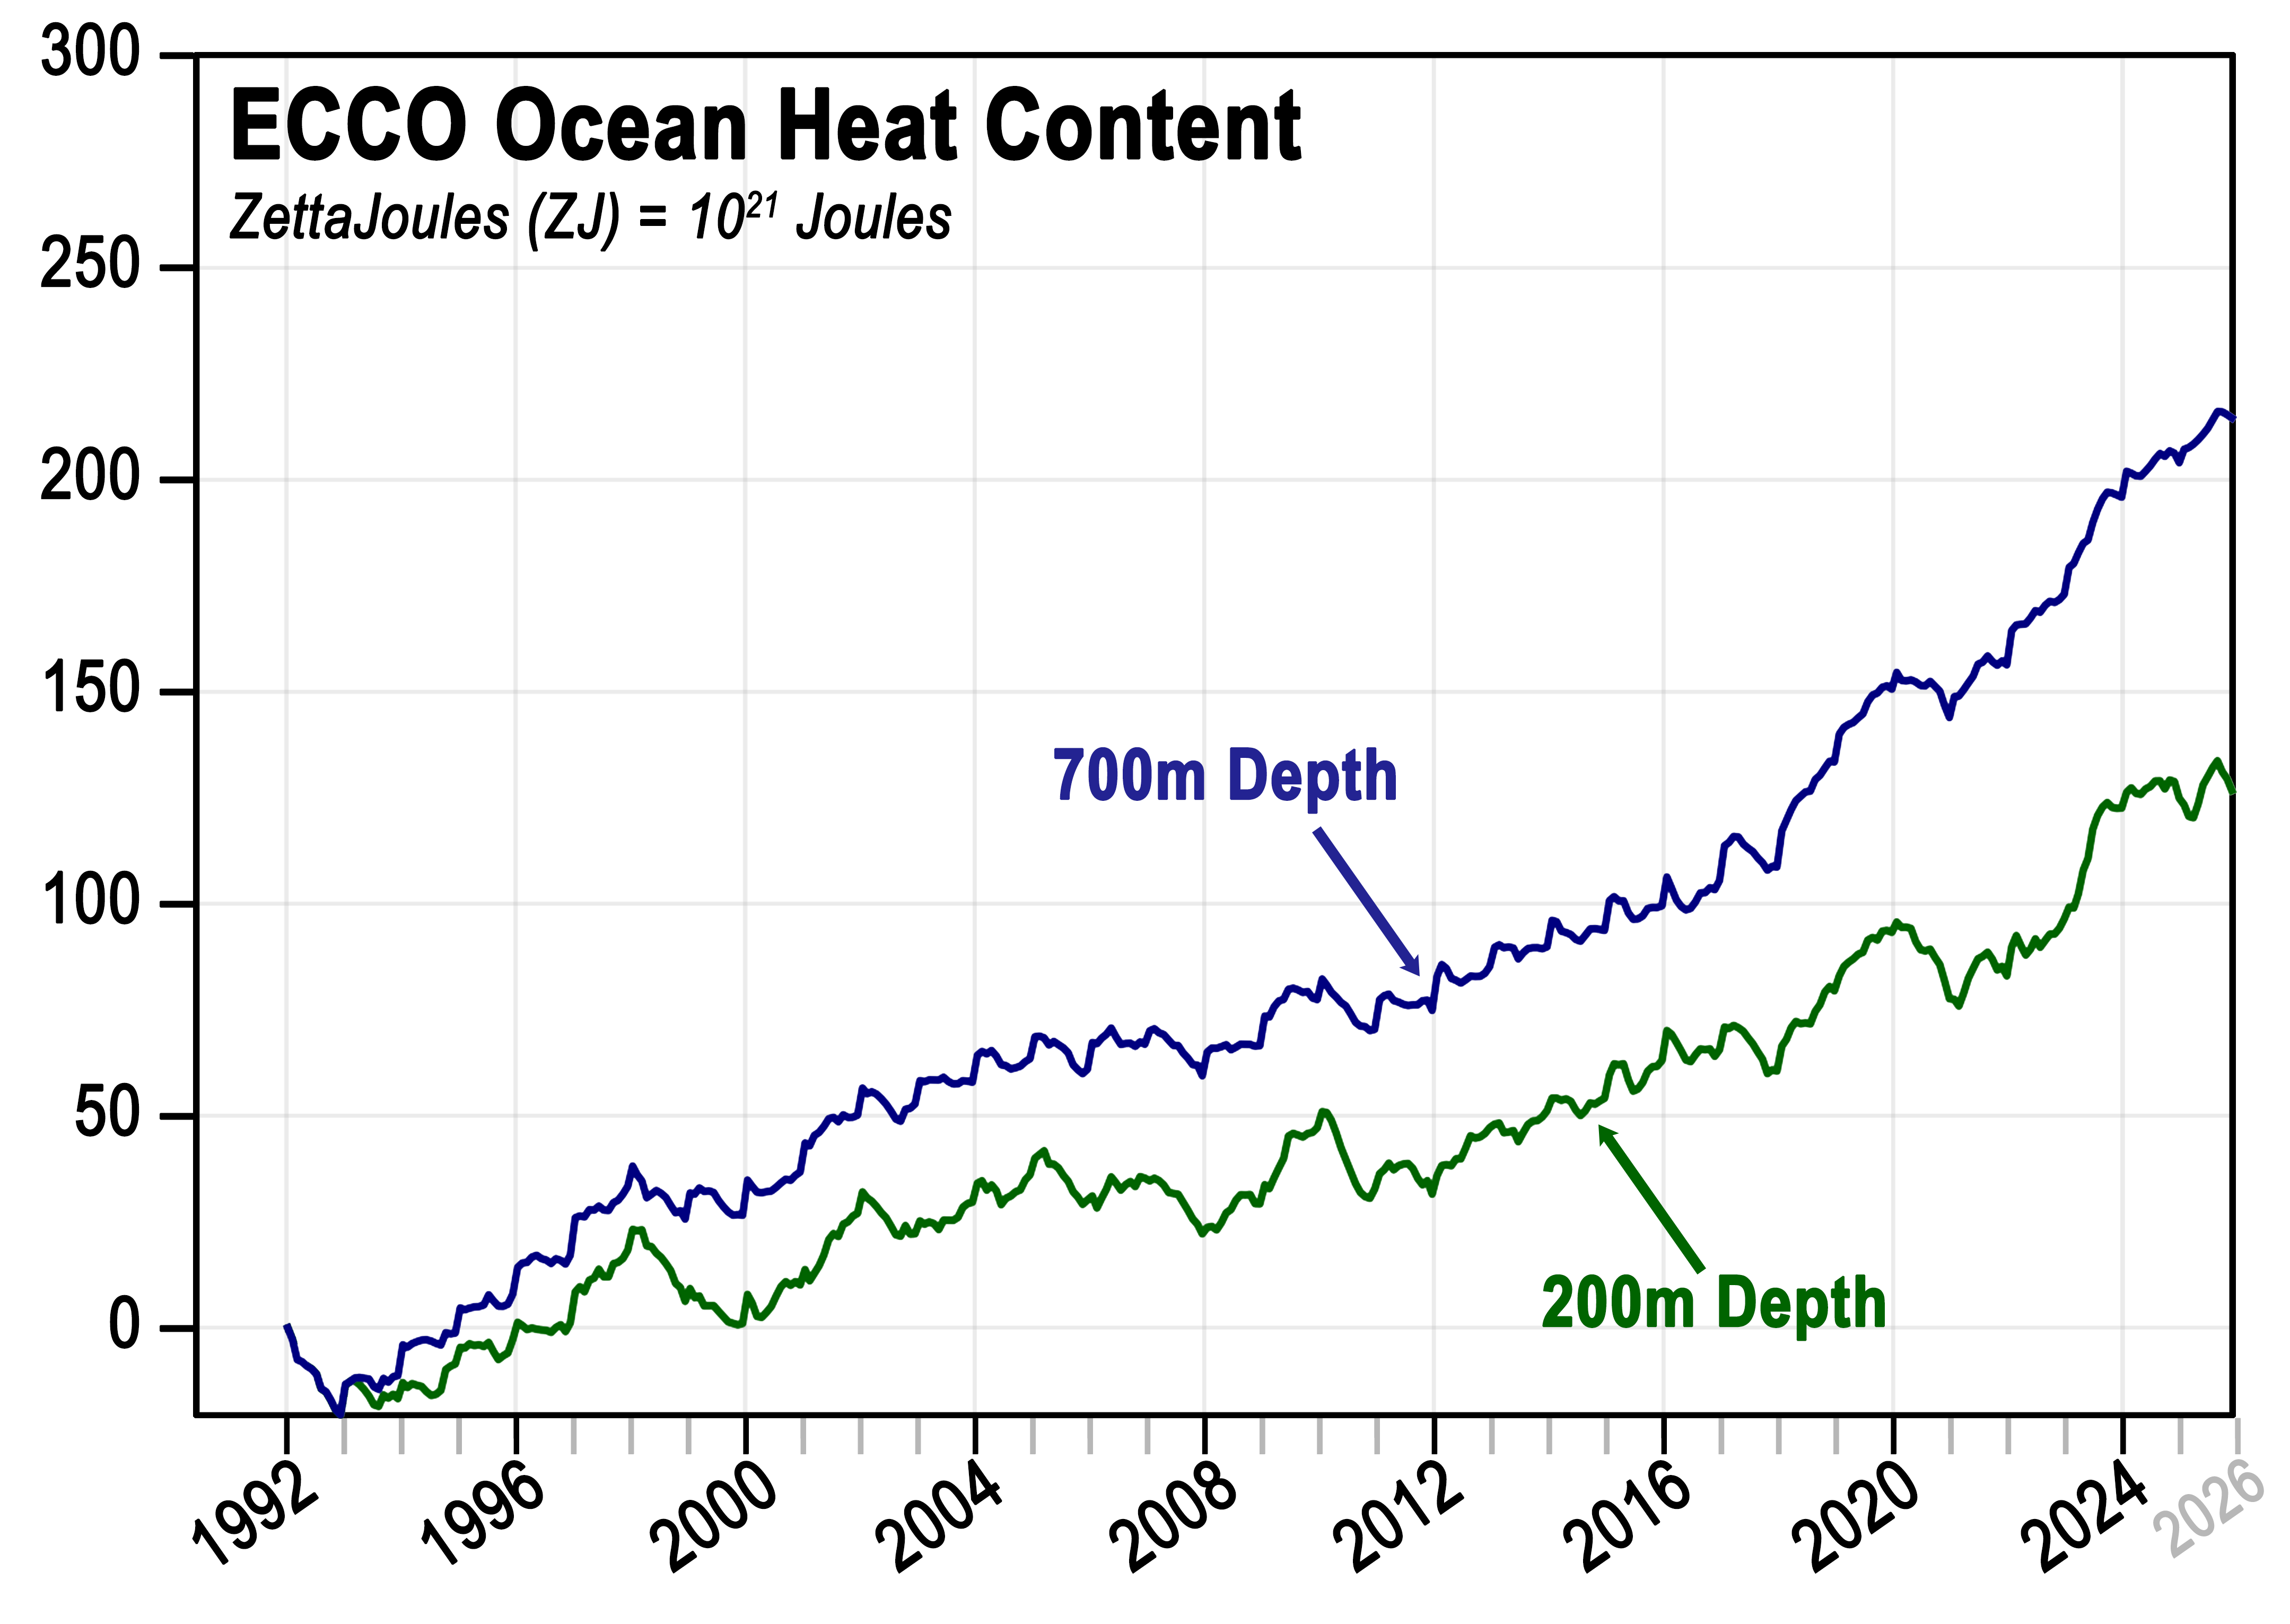
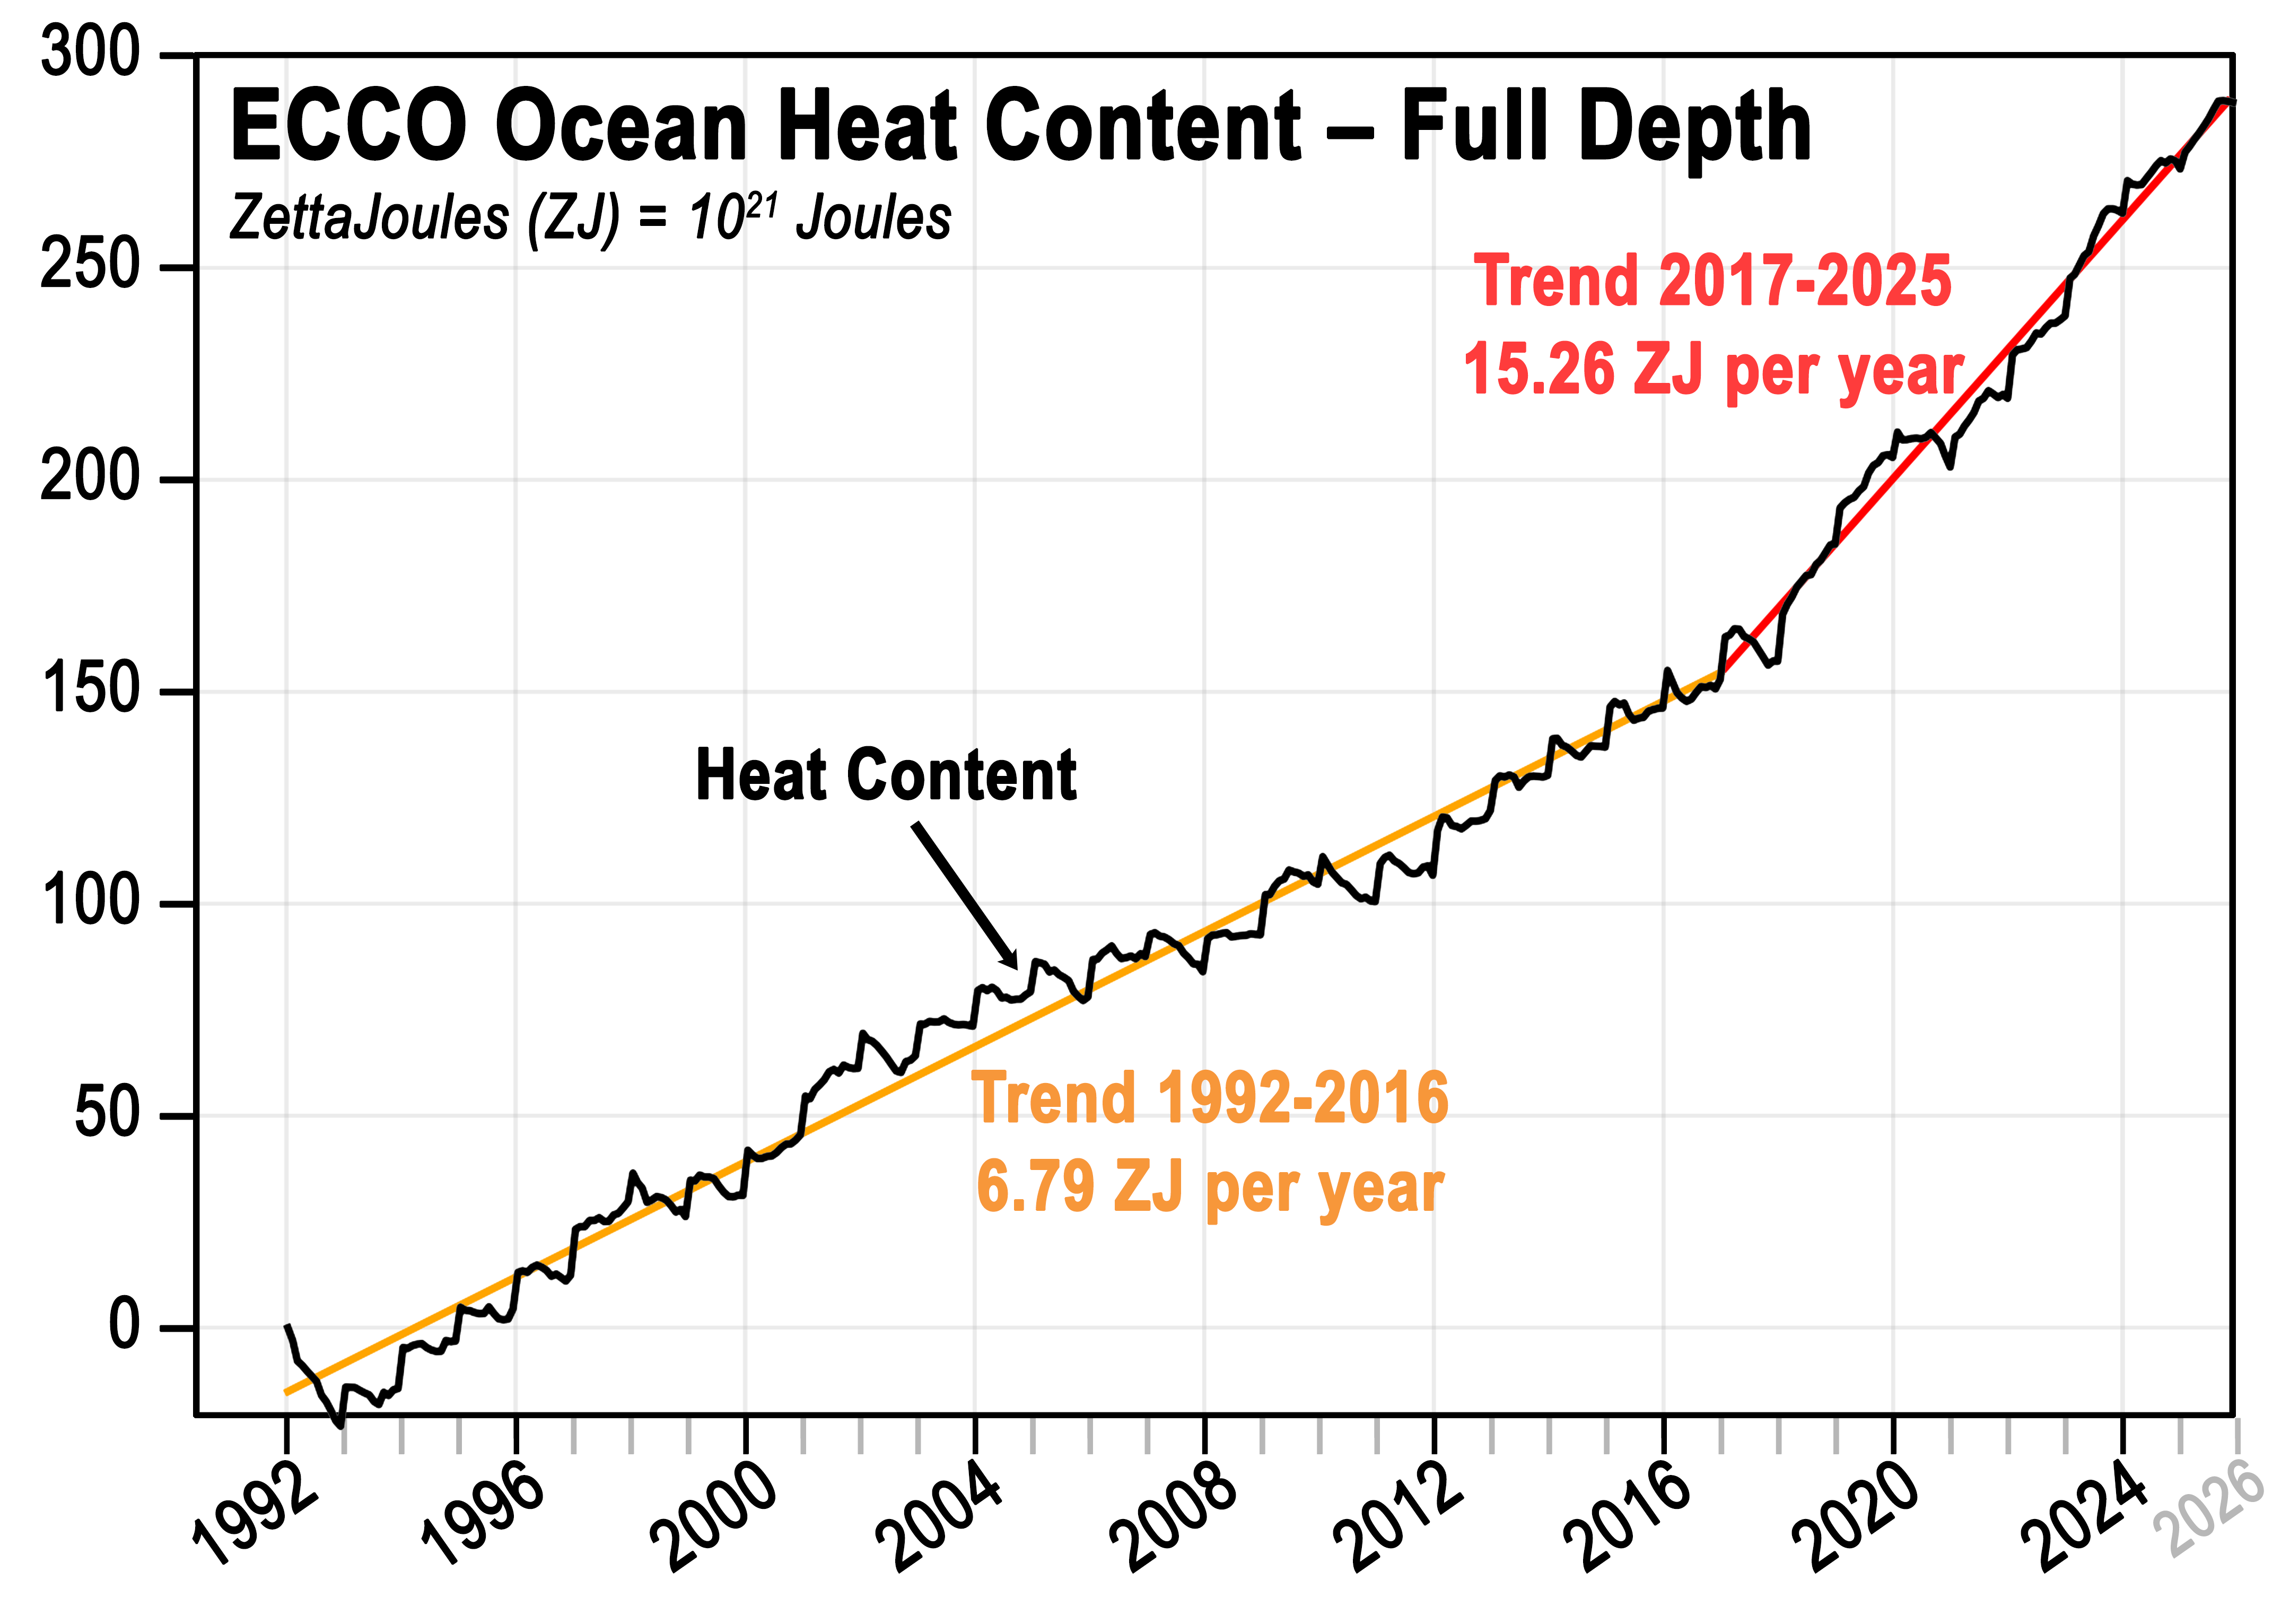
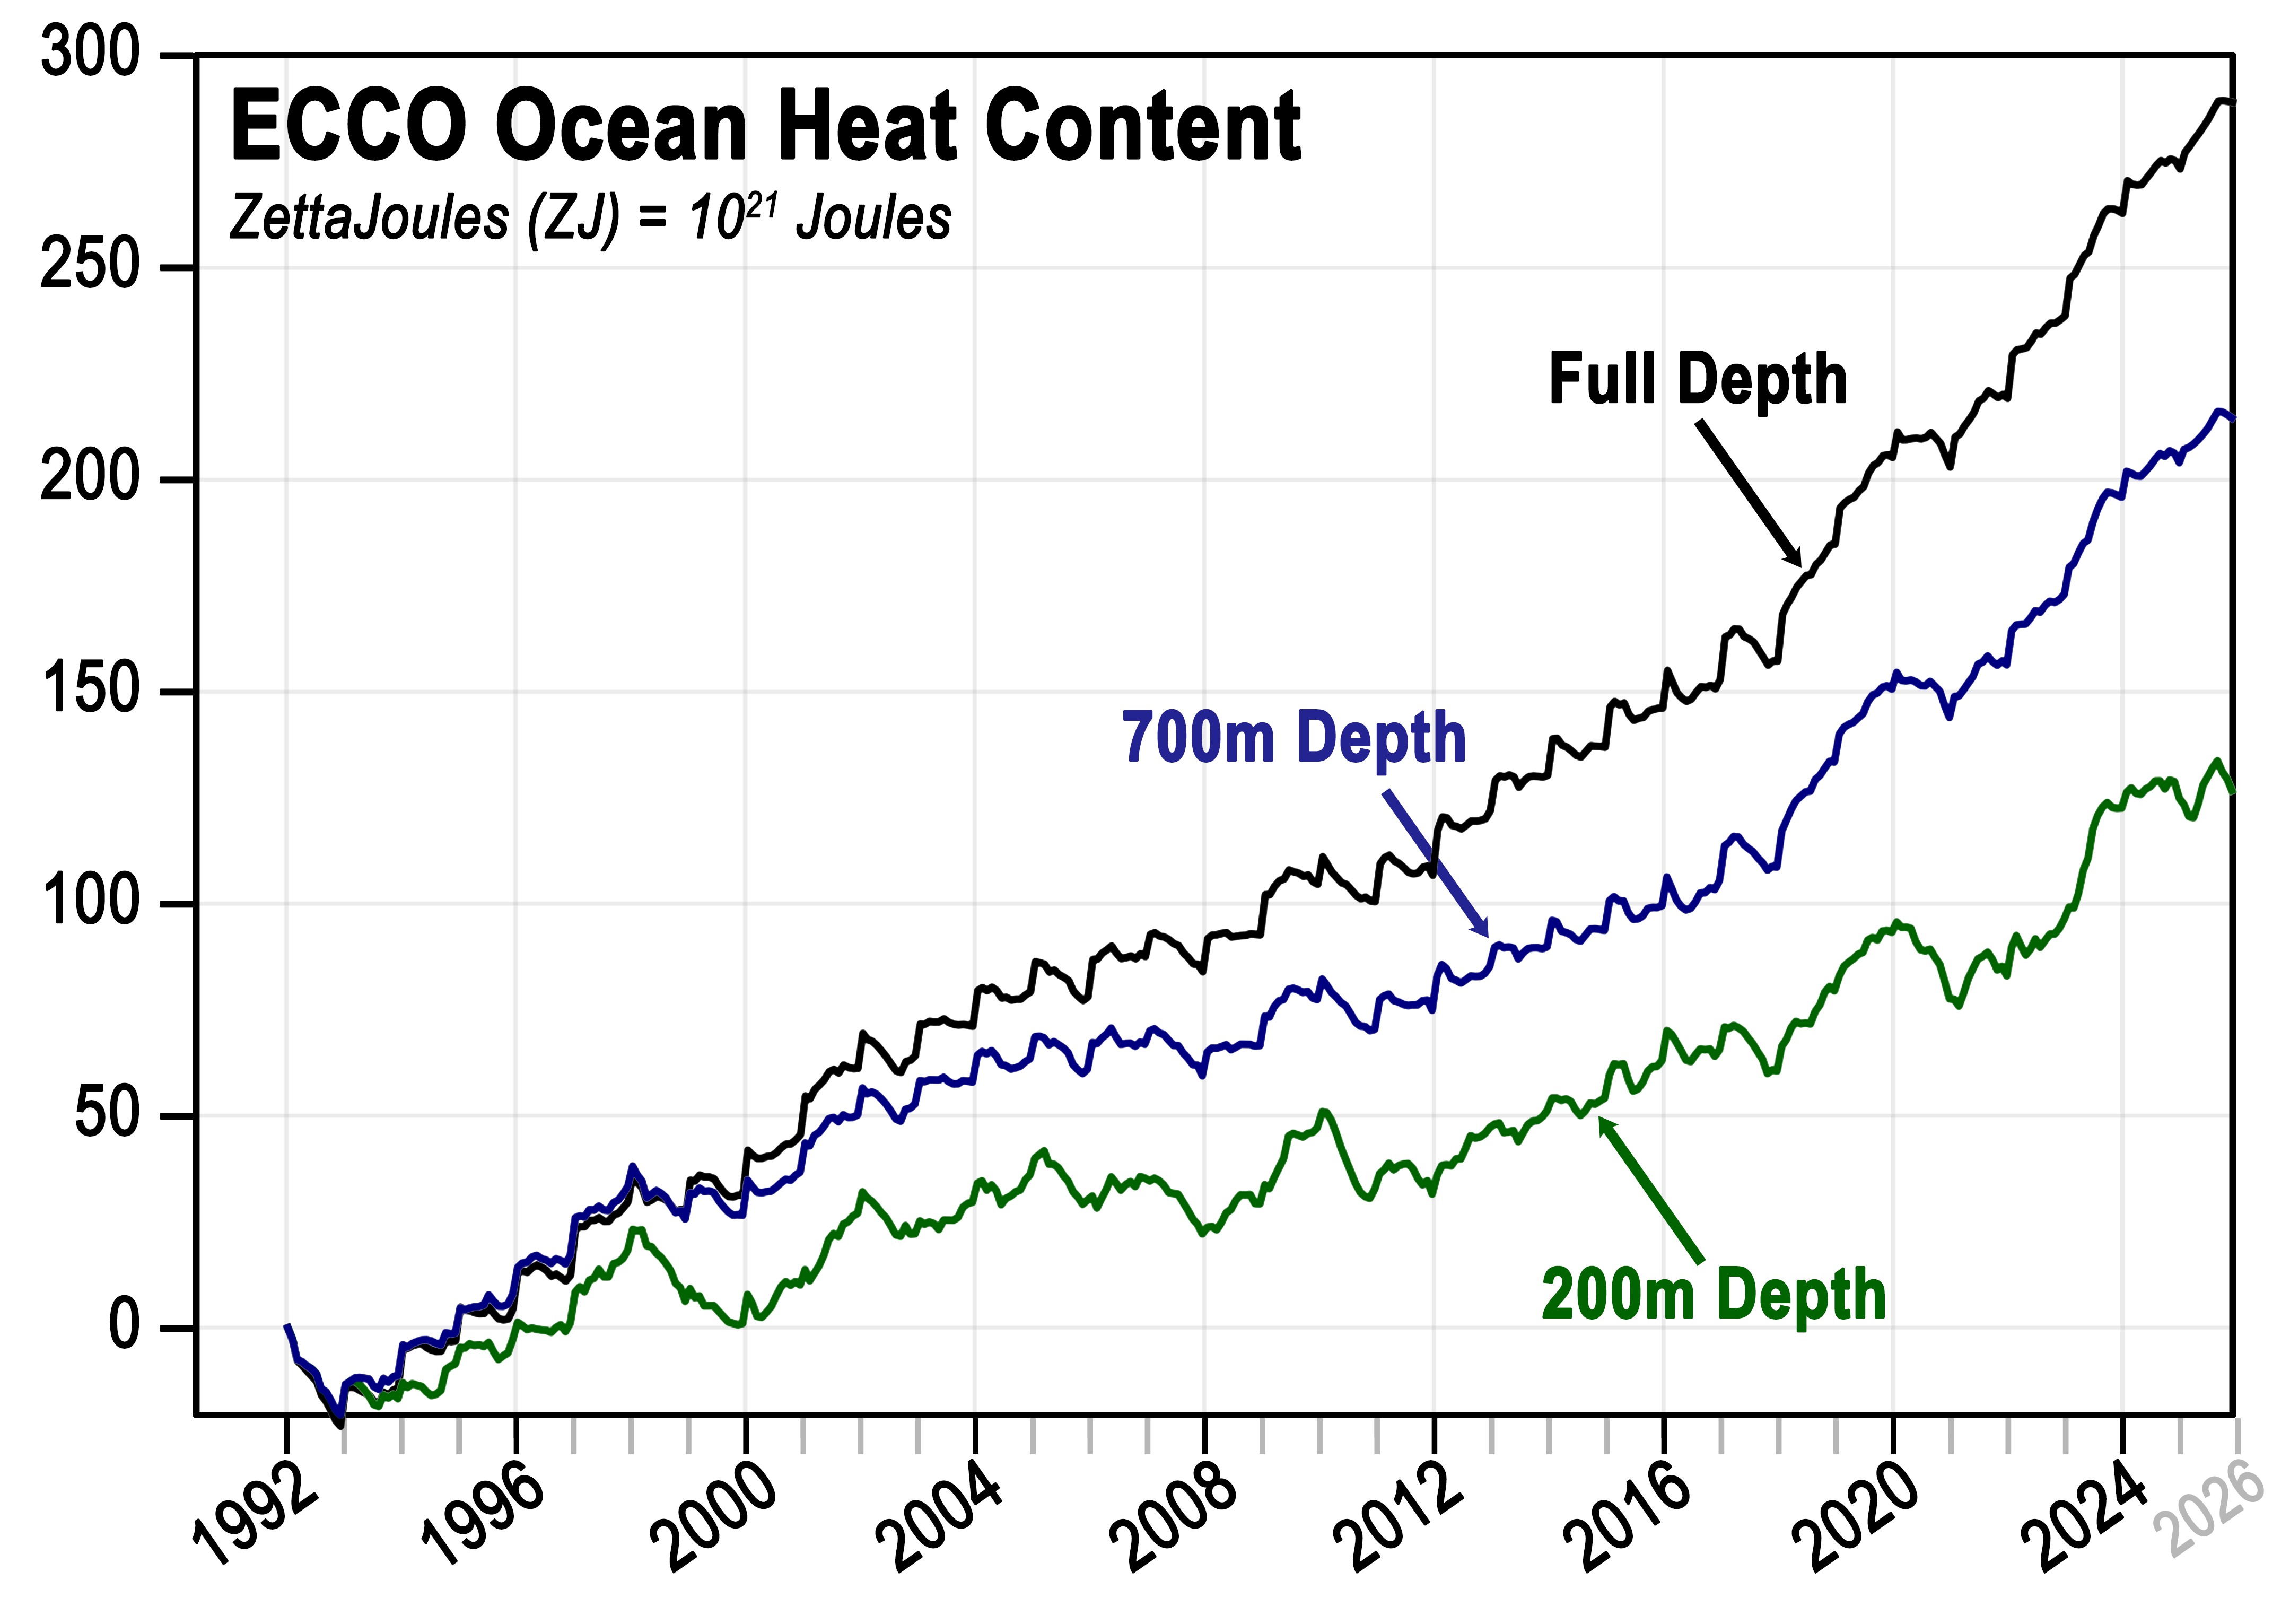
Humans live in the atmosphere, not the ocean. So you can think that the ocean doing us a huge favor… but this "favor" is not only huge, it's deep. And the depth that excess heat reaches in our ocean is important to monitor. And ECCO is in the unique position of tracking warming over the full depth of the ocean.
Our climate has been warming for decades but where does the excess heat generated by human activity go? The ocean absorbs more than 90% of the excess heat from global warming.
Humans live in the atmosphere, not the ocean. So you can think that the ocean doing us a huge favor… but this "favor" is not only huge, it's deep. And the depth that excess heat reaches in our ocean is important to monitor. And ECCO is in the unique position of tracking warming over the full depth of the ocean.