Gallery

Perpetual Ocean 2: Western Boundary Currents
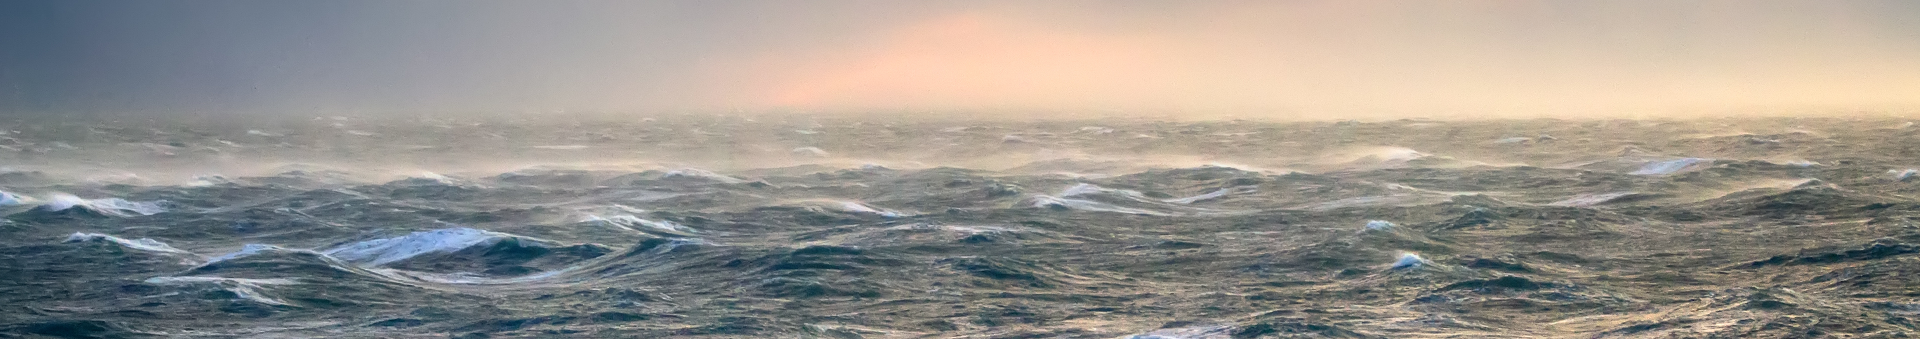
[27-Feb-2025]This is a visualization of ocean currents around the world. NASA’s ocean model, Estimating the Circulation and Climate of the Ocean (ECCO), is used to visualize the currents. The ECCO ocean circulation model incorporates observations from spacecraft, buoys, and other in situ measurements to keep the model accurate. ECCO is a joint project between NASA/JPL, MIT, and UT Austin. The model output used here is from ECCO-2 and covers the years 2021-2023.
In 2011, we used ECCO2 to create a visualization called Perpetual Ocean. Perpetual Ocean continues to be extremely popular, but it only shows ocean currents on the surface. In this new visualization, we use the ocean’s 3D velocity field to visualize some of the strongest ocean currents. We release virtual particles in the ocean and allow them to move with the ocean’s three dimensional velocity field. Each particle has a trail to better see its direction of movement. The particles initialized above 600 meters in depth have a trail length of 3 days, those initialized deeper than 600 meters have a trail length of 6 days. The particle trails help identify the strongest currents in the world that are squeezed in narrow belts on the western side of each ocean basin. These are called western boundary currents. The looping meanders in the boundary currents sometimes form turbulent rings (eddies) that can trap cold or warm waters in their centers and then separate from the main flow (see 2:30 of temperature version for an example for trapped warm water).
The visualization starts from a global rotating view before slowing down to see the Western Boundary Current along the western edge of the Pacific Ocean along the coasts of Australia, and Asia. We zoom in to show the Kuroshio Current off the coast of Japan. Along the Japanese coast, the current exhibits large meanders that can persist for many months in more or less the same location.
We then zoom out and move over the Indian Ocean and then around to the southern tip of Africa. The Agulhas Current is another Western Boundary current following the slope of the continental shelf closely. The continental shelf along the east coast of southern Africa is quite narrow and steep. This sloping topography stabilizes the Agulhas Current so that it shows no wide meanderings of the type familiar in other boundary currents such as the Kuroshio. The Agulhas Current overshoots the African continent, moving into the South Atlantic. Then retroflects back to the Indian Ocean. At the retroflection, shedding of warm (20 to 25 °C) and salty (~35.5) rings happens. The eddies detached from the current have a lifetime of more than 2 years traveling across the south Atlantic ocean. These eddies are referred to as Agulhas Rings.
Another Western Boundary Current, called the Gulf Stream comes into view along the east coast of North America. The Gulf Stream forms at the Florida Straits. It’s one of the fastest currents on Earth with surface speed of up to 2.5 meters per second. In the Gulf stream, cold cores (mostly anticyclonic ones) form when the Gulf Stream meanders eastward leaving the coast of North America (off Cape Hatteras in North Carolina). The eddy diameters can be as large as 1000 km. Zooming into the Gulf Stream, we can see that the warm surface water (>25°C) moves poleward (white particle trails). The Gulf Stream is generally the warmest and saltiest western boundary current. There’s a return current underneath at depth below 500m (the blue particle trails) moving southward carrying cold waters from the pole. The loop currents in the Gulf of Mexico are very large eddies persisting in the Gulf. They bring the warm and highly saline Caribbean water into the Gulf.
Models like ECCO-2 help scientists to understand the characteristics of these currents better and ultimately understand how heat is transported globally in the Ocean.
Read the full story and view additional videos and still images at NASA SVS.
Original Media »