
Gallery
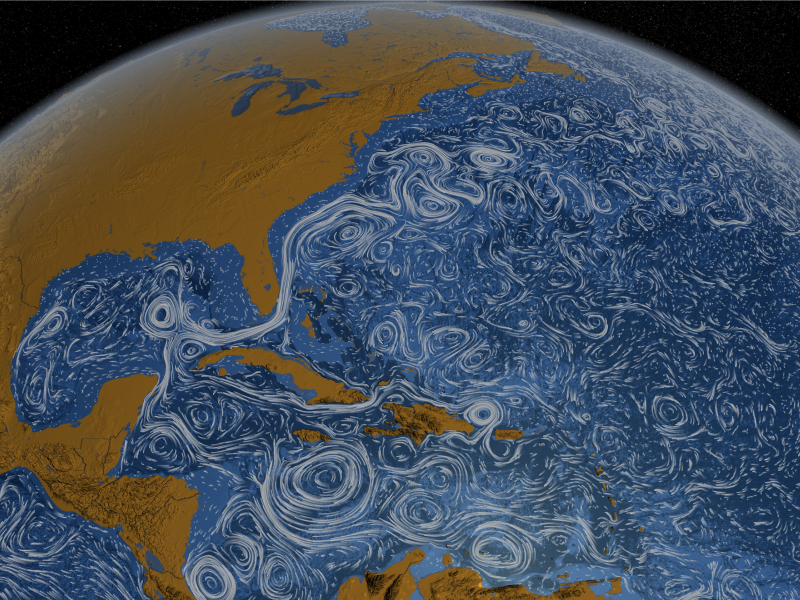
This visualization shows some of the world’s surface ocean currents. Credit: NASA/Goddard Space Flight Center Scientific Visualization Studio.
This visualization shows some of the world’s surface ocean currents. Credit: NASA/Goddard Space Flight Center Scientific Visualization Studio.
Perpetual Ocean
[15-Aug-2011] This visualization shows ocean surface currents around the world from June 2005 through December 2007. It was produced using model output from the joint MIT/JPL project: Estimating the Circulation and Climate of the Ocean, Phase II or ECCO2. ECCO2 uses the MIT general circulation model (MITgcm) to synthesize satellite and in-situ data of the global ocean and sea-ice at resolutions that begin to resolve ocean eddies and other narrow current systems, which transport heat and carbon in the oceans. ECCO2 provides ocean flows at all depths, but only surface flows are used in this visualization. The dark patterns under the ocean represent the undersea bathymetry. Topographic land exaggeration is 20x and bathymetric exaggeration is 40x. View additional videos and still images at NASA SVS. Original Media » Click on the image to play the movie. Click on the Escape key or anywhere outside the shadowbox to close.