Gallery
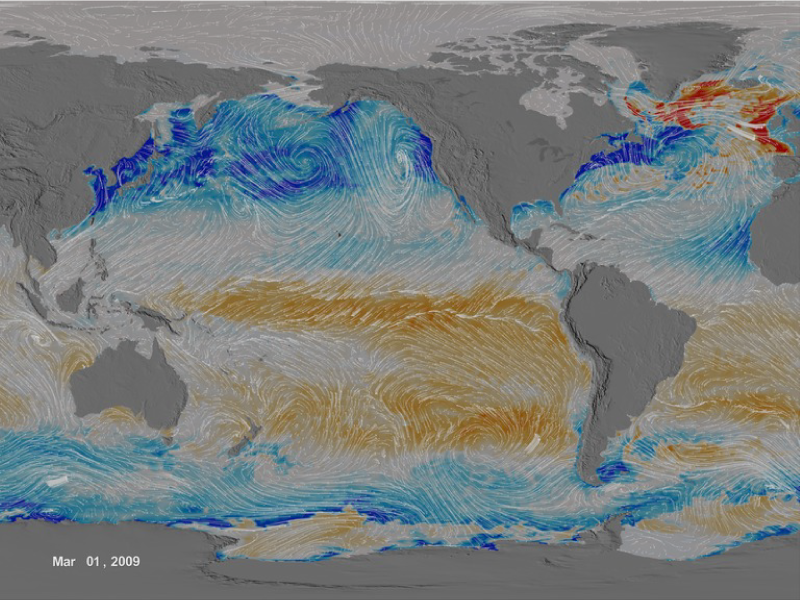
This animation shows the ocean surface CO2 flux between 1/1/2009 and 12/31/2010. Blue colors indicate uptake and orange-red colors indicate outgassing of ocean carbon. The pathlines indicate surface wind stress. Credit: NASA’s Scientific Visualization Studio (MP4, 190.7 MB).
This animation shows the ocean surface CO2 flux between 1/1/2009 and 12/31/2010. Blue colors indicate uptake and orange-red colors indicate outgassing of ocean carbon. The pathlines indicate surface wind stress. Credit: NASA’s Scientific Visualization Studio (MP4, 190.7 MB).
Ocean Surface CO2 Flux with Wind Stress
[18-Nov-2015] There are no direct global-scale observations of carbon fluxes between the land and oceans and the overlying atmosphere. Understanding the carbon cycle requires estimates of these fluxes, which can be computed indirectly using models constrained with global space-based observations that provide information about the physical and biological state of the land, atmosphere, and ocean. This animation shows results from the ECCO2-Darwin ocean carbon cycle model, which was developed as part of the NASA Carbon Monitoring System (CMS) Flux Project. The objective of the CMS-Flux project is to attribute changes in atmospheric accumulation of carbon dioxide to spatially resolved fluxes by utilizing the full suite of NASA data, models, and assimilation capabilities. ECCO2-Darwin is based on a global, eddying, ocean and sea ice configuration of the Massachusetts Institute of Technology general circulation model (MITgcm) and on results from the Estimating the Circulation and Climate of the Ocean, Phase II (ECCO2) Project, which provides a data-constrained estimate of the time-evolving physical ocean state, and the Darwin Project, which provides time-evolving ocean ecosystem variables. Together, ECCO2 and Darwin provide a time-evolving physical and biological environment for carbon biogeochemistry, which is used to compute surface fluxes of carbon at high spatial and temporal resolution. The animation shows air-sea carbon flux and surface wind stress for the 2009-2010 period. Blue colors indicate uptake and orange-red colors indicate outgassing of ocean carbon by the ocean ranging from -5 to 5x10⁻⁷ mol C/m2/s. The pathlines indicate surface wind stress, which is one of the drivers of air-sea carbon exchange. For example, note the hurricanes in the North Atlantic and East Pacific in June to November, shown as outgassing events around the hurricane eye in regions of maximum wind.Original Media » Click on the image to play the movie. Click on the Escape key or anywhere outside the shadowbox to close.
To download a copy, right click on the image and select Download Linked File (on a Mac keyboard, click the touchpad while holding down the Control key).


