
Gallery
Flow layers composited over star layer with a wipe from white flows to sea surface temperature flows. Credit: NASA/Goddard Space Flight Center Scientific Visualization Studio (MP4, 23.2 MB).
Flow layers composited over star layer with a wipe from white flows to sea surface temperature flows. Credit: NASA/Goddard Space Flight Center Scientific Visualization Studio (MP4, 23.2 MB).
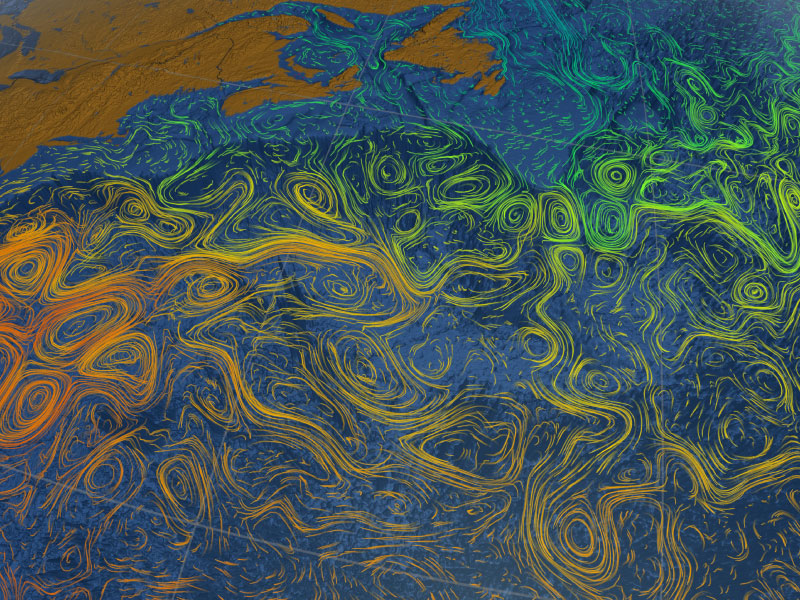
Gulf Stream Sea Surface Currents and Temperatures
[15-Feb-2012] This visualization shows the Gulf Stream stretching from the Gulf of Mexico all the way over towards Western Europe. It sas designed for a very wide, high resolution display (e.g., a 5x3 hyperwall display). This visualization was produced using model output from the joint MIT/JPL project entitled Estimating the Circulation and Climate of the Ocean, Phase II (ECCO2). ECCO2 uses the MIT general circulation model (MITgcm) to synthesize satellite and in-situ data of the global ocean and sea-ice at resolutions that begin to resolve ocean eddies and other narrow current systems, which transport heat and carbon in the oceans. The ECCO2 model simulates ocean flows at all depths, but only surface flows are used in this visualization. There are 2 versions provided: one with the flows colored with gray, the other with flows colored using sea surface temperature data. The sea surface temperature data is also from the ECCO2 model. The dark patterns under the ocean represent the undersea bathymetry. Topographic land exaggeration is 20x and bathymetric exaggeration is 40x.Original Media » Click on the image to play the movie. Click on the Escape key or anywhere outside the shadowbox to close.
To download a copy, right click on the image and select Download Linked File (on a Mac keyboard, click the touchpad while holding down the Control key).